


Variable Rate Fertilizer ROI – Is Precision More Profitable Than Flat-Rate?
Fertilizer is among the highest variable costs in many cropping systems. The conventional flat (uniform) application rate has been simple and reliable, but it often leaves money on the table – either through over‐application in low‐potential areas or under‐application in high‐yield zones.
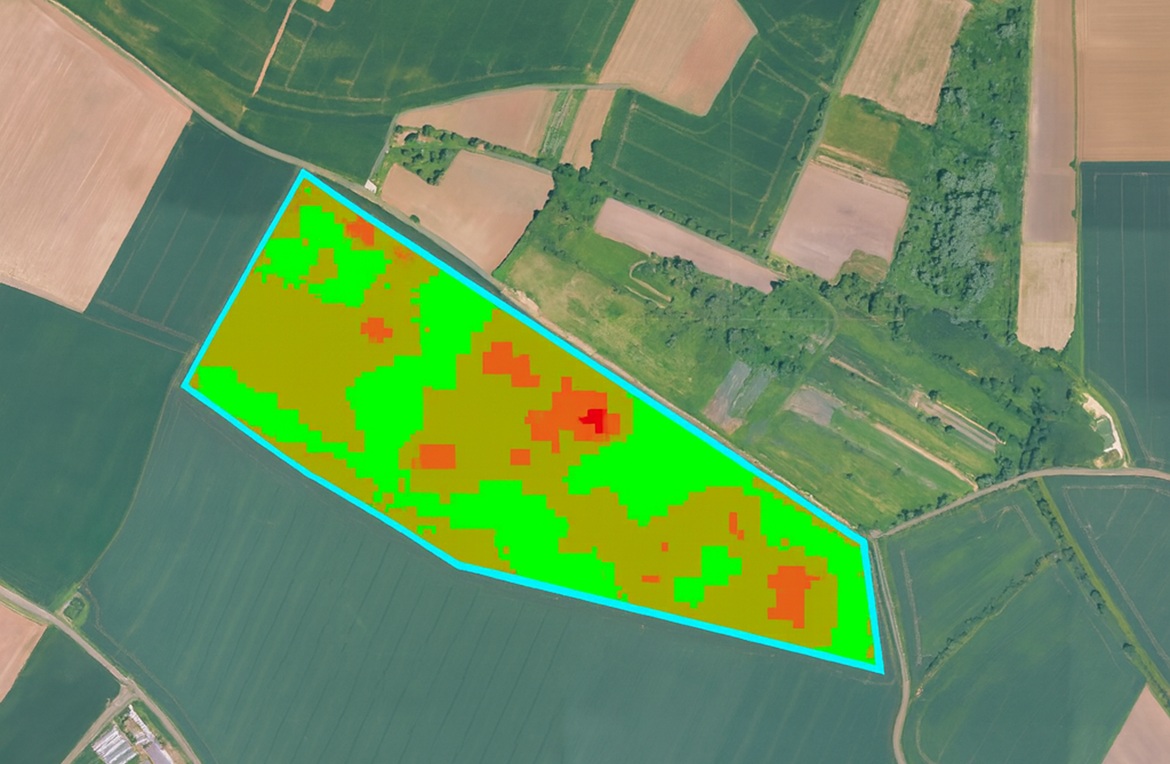
Variable Rate Fertilizer (VRT) technology, also known as precision fertilizer application, offers a tailored approach to nutrient management. Instead of applying flat-rate fertilizer across the entire field, it targets nutrients where they are most needed. In this practice, inputs are being matched more precisely to soil nutrient status, yield potential, moisture availability, and other spatial variability.
However, adoption depends on whether the ROI justifies the extra work, investment, and risk.
The key questions are: What are the real profit gains? Does it pay off?
What Determines ROI in Variable Rate Fertilizer (VRT) Programs?
To understand the real profit from Variable Rate Fertilizer programs, farmers need to calculate ROI by balancing three main factors:
Input Savings
- Avoids over-application by reducing inputs in nutrient-rich zones.
- Matches nutrient rates more closely to crop need, increasing input efficiency.
Yield Gains
- Boosts yields in responsive areas through targeted nutrition.
- Reduces yield inconsistency by aligning fertility with zone-specific potential
Implementation Costs
- Soil sampling costs.
- Prescription map generation and software.
- Technology investments (variable rate applicators, controllers).
- Agronomic consultancy fees.
ROI = (Yield Revenue Gain + Input Savings – Implementation Costs) ÷ Implementation Costs
Breakdown of ROI Drivers in VRT Systems
The following table outlines how to quantify the components of VRT profitability.
Evidence From the Field – Real-World Results from Precision Fertilizer Application
Research and on-farm experience have shown mixed but generally positive results:
Case Study 1: Midwestern U.S. Variable Rate Nitrogen Prescriptions
Over 17 site-years across 13 fields in the Midwest, farmers tested variable rate nitrogen (VRN) prescriptions using NDVI (remote sensing) and historical yield data, compared to standard flat-rate nitrogen applications on corn.
Results across multiple fields:
- Fertilizer savings: Up to 20% in zones with sufficient early-season vigor
- Yield impact: Ranged from slight decreases to +5% increases, depending on zone and season
- Profitability range: From −$410/ha (poor match in drought year) to +$350/ha (excellent N match in ideal year)
- Key insight: Profitability depended on accurate prescription data – NDVI-based maps outperformed static historical maps in variable seasons
Case Study 2: UK Wheat Grower Trial – Variable Rate Nitrogen ApplicationA commercial wheat grower in eastern England implemented variable rate nitrogen (VRN) applications using N-Sensor data and biomass maps, compared against a flat-rate control strip on the same field.
Results after one season:
- Fertilizer input: Reduced from 630 kg/ha to 595 kg/ha in variable-rate areas
- Yield impact: +0.28 t/ha on average in VRN zones
- Gross margin increase: £105.86/ha
- Projected gain: If applied across 339 ha, £35,887 in added profit
- Additional benefit: Higher grain protein in high-rate zones improved marketability
Case Study 3: Iowa State University – Variable Rate P and K ApplicationOn-farm trials in Iowa compared variable rate applications of phosphorus (P) and potassium (K) with flat-rate fertilization across commercial fields.
Results:
- Soil-test variation: Significantly reduced in VRT zones
- Nutrient efficiency: Better targeting of low- and high-fertility areas
- Yield impact: Modest and inconsistent differences compared to flat-rate
- Profitability: Dependent on soil variability, fertilizer-to-grain price ratios, and soil sampling costs
- Added value: Improved long-term soil fertility balance and reduced risk of over-application
General Trends
Across studies in Europe and North America, the following patterns have emerged:
On average, ROI from VRT fertilizer ranges from $20 to $50/acre under favorable conditions, with break-even often achieved by year 2 or 3.
What Affects How Big the Profit Gains Will Be
From comparing multiple studies, these are the factors that most influence whether VRT produces big vs small profit gains:
Practical Steps for Farmers & Agronomists to Measure ROI
If you are considering adopting VRT (or already have), here’s a practical framework to measure your ROI vs flat rate, tailored for your context.
- Select test fields or zones
Pick fields or parts of fields where you suspect variability is high. Run VRT on those, and keep similar fields under uniform rate as controls. - Collect data
- Map soil fertility (grid or zone) with proper lab analysis.
- Collect yield maps during harvest; separate yield by management zones where possible.
- Track all VRT costs and flat-rate costs.
- Note crop price, other inputs, and weather.
- Compute partial budgets
Extra revenue (yield × price) + input savings − extra VRT costs = net gain per ha/zone. - Perform break-even analysis
Based on fixed/one-time costs, how many years or hectares to recover them? - Refine over time
Use early results to improve zones, prescriptions, timing. - Consider externalities
Include monetizable environmental benefits, risk reduction, incentives.
These steps apply to any variable rate nutrient strategy, whether you’re using precision fertilizer application systems, zone-based fertility maps, or integrated variable rate technology (VRT) setups.