

Using NDVI as a Tool to Monitor Crop Growth and Health
Introduction
NDVI, or Normalized Difference Vegetation Index, is a tool used to monitor crop health and growth. It is a measure of the greenness of a surface and provides an automated way to monitor the progress of the crop and its health throughout the growing season.
The advantage of using NDVI over traditional methods, like chlorophyll fluorescence, is that it can be measured from space or with drones, without needing any on-site equipment.
The use of NDVI as a tool for crop monitoring has been well studied over the past few decades, and it has been shown to be an effective tool for many applications. Some models have been developed to use NDVI to predict crop biomass and yield, manage nitrogen fertilization, irrigation management and other uses.
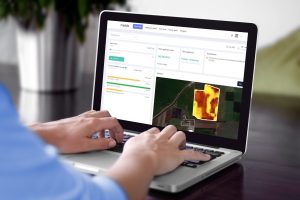
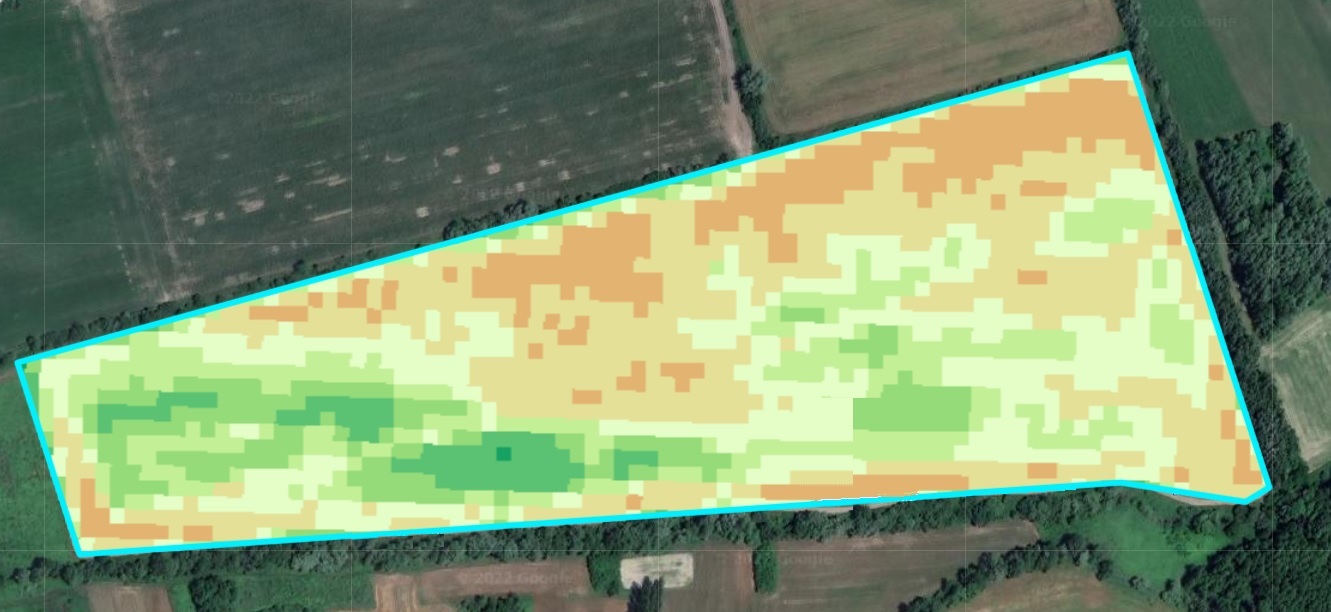
Colored maps, that show the variability in the field can be produced based on NDVI values.
In this article we will review some examples of how NDVI has been used successfully, as well as potential uses for future research projects.
How is NDVI calculated?
NDVI is obtained by measuring the difference between the near infrared light reflected and the visible red light reflected and calculating it against the total amount of radiation that emits from the earth’s surface:
NDVI = (NIR – RED)/(NIR + RED)
Green plants absorb light energy from their surroundings and use it to synthesize sugars and other organic compounds. As a result, they reflect more near infrared light and absorb visible red light. In general, higher values indicate more vegetation or healthy crops, while lower values indicate less-healthy plants or crops that aren’t growing well. An NDVI value between 0 and 1 is commonly considered optimal for crop growth; values less than 0 indicate areas with too little vegetation for photosynthesis to occur effectively (such as during drought). Negative NDVI corresponds to water.
NDVI for nitrogen management
NDVI can be a useful tool to help you determine nitrogen deficiency, excess ,and stress in various crops. A good correlation was found between NDVI and nitrogen content in the leaves in crops such as corn, wheat, and rice. Since nitrogen is a major component of the chlorophyll molecule, that is associated with leaf color, the concentration of nitrogen in the leaves affects light absorbance and reflectance.
Satellite imagery and drones can provide data at a relatively high resolution. For example, Sentinel 2 satellite provides data for 20x20m pixels. This can be used to create variable rate nitrogen application prescriptions.
In addition to providing information about current nitrogen content, NDVI can help predict yield potential and nitrogen availability for the upcoming growing season.
NDVI for biomass and yield prediction
The relationship between biomass, yield potential and NDVI values has been studied extensively in many cropping systems including corn grain production systems that are sensitive to nitrogen (N) stress. Researchers found that a high correlation exists between NDVI values taken during early vegetative growth stages with final yields later on in the growing season.
NDVI can be used for this purpose because it provides an indication of the amount of green plant material present in a field. Green leaf area is an excellent predictor of yield potential because it reflects available light energy that drives photosynthesis, which leads directly to grain filling and development.
Most of the methods to predict crop yields based on NDVI use regression models, analyzing datasets of NDVI and actual yield data.
NDVI for disease detection
This is perhaps the most common use of NDVI currently. Because of this relationship between leaf area and NDVI value, it is possible to use NDVI as a tool for detecting crop stress caused by environmental factors and disease outbreak.
The NDVI of diseased plants is lower than healthy plants, which means it can be used as a proxy for plant health. When combined with other data, such as leaf area index or chlorophyll content, NDVI can be used to detect diseases in large fields, before they spread to other parts of the field. Note that specific disease identification cannot be achieved with NDVI.
Note that specific disease identification cannot be achieved with NDVI. However, disease-affected areas in the field will have low NDVI values. Looking at the NDVI map, the farmer can go directly to the suspected zones, instead of having to inspect the entire field.
NDVI for irrigation management
NDVI can be used to determine irrigation requirements, efficiency, and timing. Several regression models for estimating the actual crop coefficient (Kc) were developed. The crop coefficient is the ratio between crop evapotranspiration (ETc) and reference evapotranspiration (ET0). ETc varies between crops and the growth stage of the crop.
The irrigation requirement for a specific period is determined by multiplying Kc by ET0, I (mm) = Kc x ET0.
While ET0 can be easily estimated from weather data, in real time, Kc is usually obtained from tables. However, the tabular data is often not accurate or does not coincide with the actual status of the field (for example, if the crop is stressed and has not developed properly). Furthermore, tabular Kc cannot account for variability within the field.
Obtaining the crop coefficient in real-time and for different zones of the field can be useful in determining the right irrigation rates.
Downsides of using NDVI
Using NDVI also has some downsides:
- NDVI can vary greatly due to weather conditions such as precipitation, humidity levels, where the most restricting factor, if obtained from satellites, is cloud cover.
- It can only provide insight of what already happened in the field, which may sometimes be too late.
- NDVI might saturate at high crop densities, meaning that the same NDVI values are obtained despite variability in the field.
- In addition to the saturation issue, the use NDVI is not suitable for all crops and conditions.
Other vegetation indices may have lower sensitivity to saturation and are used in different models. Such indices include MSAVI, CVI, reNDVI, MTCI and others.
Summary
NDVI is an excellent tool for crop monitoring. It can be used to monitor the health of plants, predict their yields, detect pests and diseases, and even optimize irrigation. One of the downsides, however, is that it requires some knowledge of how to interpret it (or an automated tool), as well as access to data from satellites or drones that can take photos at regular intervals over large areas.
The research of new predictive models, using both NDVI and other indices, continues.