


Beyond NDVI: What Other Indices Tell Us About the Crop
For years, NDVI (Normalized Difference Vegetation Index) has been the most popular metric in precision agriculture. It’s simple, well-known, and broadly available across satellite and drone platforms. But as powerful as NDVI is for monitoring canopy vigor, its usefulness for decision-making has clear limits. NDVI saturates in dense crops, doesn’t distinguish between stress causes, and often reacts only after a problem is already visible.
Today, new layers of remote sensing, such as thermal infrared, chlorophyll indices, and Synthetic Aperture Radar (SAR) are helping agronomists and farmers look beyond NDVI. These layers provide earlier, more precise insights into water stress, nutrient imbalances, and disease development.
The limits of NDVI
NDVI measures the difference between near-infrared (NIR) and red reflectance. Healthy leaves reflect more NIR and absorb more red light due to chlorophyll, so NDVI increases with vegetation vigor. Yet NDVI has three major weaknesses:
-
Saturation: In dense canopies (e.g., corn after V8, wheat after booting, or mature orchards), NDVI values reach a plateau even if plant condition keeps changing.
-
Ambiguity: A low NDVI can mean poor nutrition, water deficit, or disease, NDVI doesn’t tell which.
-
Delayed response: NDVI declines only after chlorophyll content and photosynthesis are already reduced. By then, the damage is often done.
To make satellite data actionable, we should combine NDVI with other indices that respond earlier and specifically to physiological changes.
Thermal imagery: detecting water stress before wilting
When plants experience water stress, the first reaction is stomatal closure, reducing transpiration to conserve water. Because transpiration cools the leaves, any restriction quickly increases canopy temperature. Thermal cameras, whether on drones or satellites, detect this temperature rise days before visual symptoms or NDVI decline appear.
Thermal-based irrigation monitoring
Thermal data from sensors such as Landsat 8/9 or ECOSTRESS allow for regional and field-scale monitoring of canopy temperature. These datasets are coarser in spatial resolution (30–100 m) but can be valuable for irrigation planning and calibration of higher-resolution indices (e.g., NDWI or MSI).
When thermal data are unavailable, spectral proxies using short-wave infrared (SWIR) and near-infrared (NIR) bands, like the Normalized Difference Water Index (NDWI) or Moisture Stress Index (MSI), can act as practical surrogates. These indices capture variations in leaf water content and serve as early indicators of plant water status at 10–20 m resolution.
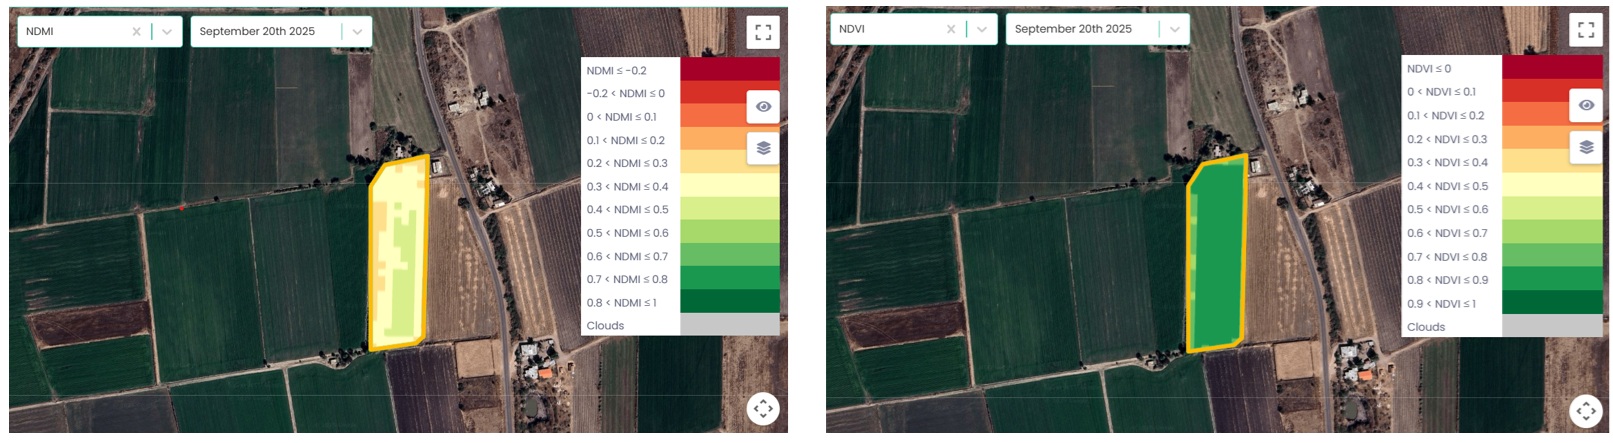
Thermal and moisture-sensitive indices provide valuable insight into crop water status beyond what NDVI can capture. While NDVI mainly reflects chlorophyll and canopy density, indices such as NDMI (Normalized Difference Moisture Index) respond to changes in leaf and canopy water content. High NDMI values indicate high internal leaf moisture, whereas a decline in NDMI can signal early water stress.
In the example below, NDVI values are uniformly high (0.9–1.0), suggesting a dense, healthy canopy. However, NDMI is significantly lower and shows non-uniform pattern, indicating reduced leaf water content despite vigorous green biomass. This means that crop appears visually healthy, but the NDVI-NDMI divergence reveals mild water stress.
The Red Edge: Where Nutrient Stress First Appears
While NDVI saturates in dense crops, red-edge and chlorophyll indices maintain sensitivity. As chlorophyll increases, the red-edge shifts slightly toward longer wavelengths, and moves back as chlorophyll decreases.
Common indices include:
- NDRE (Normalized Difference Red-Edge Index): Detects subtle variations in chlorophyll content.
- MTCI (MERIS Terrestrial Chlorophyll Index): Estimates total chlorophyll for nutrient monitoring.
- CIred-edge (Chlorophyll Index Red-Edge): Highly correlated with leaf N concentration.
Nutrient imbalance detection
Trials have shown that NDRE maps often reveal spatial variability in canopy chlorophyll within 10–15 days after topdressing, while NDVI remained largely uniform. Tissue analyses from such fields typically confirmed lower nitrogen levels in low-NDRE zones, supporting the use of NDRE for early diagnosis of N variability and guiding variable-rate fertilization strategies that can reduce total nitrogen use by around 10–15% without affecting yield.
Chlorophyll-based indices are particularly useful for fine-tuning nitrogen during rapid vegetative growth. Unlike NDVI, which mostly reflects canopy structure, NDRE and MTCI respond directly to leaf pigment concentration, an excellent indication of plant N status. While NDRE focuses on subtle chlorophyll differences within the canopy, MTCI captures total canopy chlorophyll, making it more suitable for mapping overall N distribution at later growth stages. Both NDRE and MTCI can also help identify sulfur deficiency, since low S often reduces chlorophyll despite adequate N.
Early disease signals
NDRE can also provide early warning for disease, since many diseases cause a reduction chlorophyll before symptoms are available. For example, in wheat infected by yellow rust, NDRE declined 5–7 days before visible symptoms or NDVI change. Integrating these indices with local weather and phenology data enabled predictive alerts for fungicide timing, applying protection just before the infection cycle accelerated.
SAR (Synthetic Aperture Radar): seeing through clouds and structure
Unlike optical sensors, SAR uses microwave signals to measure backscatter, which depends on canopy moisture, structure, and roughness. The advantage is that SAR works day or night, through clouds, making it ideal in tropical or rainy regions.
Waterlogging and soil compaction detection
In soybean fields in southern Brazil, SAR backscatter from Sentinel-1 increased sharply after heavy rains. The radar signal remained high in certain zones even after several dry days, indicating persistently high soil moisture. These areas later showed yield reductions of 18–25%.
Structure and biomass estimation
SAR is also useful for estimating crop structure and biomass, especially in crops like corn, sorghum, or sugarcane, where NDVI saturates. As stalks elongate and canopies thicken, radar backscatter increases in a nearly linear relationship with biomass, allowing better growth tracking during mid-season when NDVI provides little differentiation.
In contrast, when canopy structure collapses, SAR detects it immediately. For example, in barley fields in Mexico, affected by wind-induced lodging, NDVI remained high since leaves stayed green and photosynthetically active, but RVI maps clearly showed red zones with low values. The flattened canopy reflects radar energy away from the sensor, resulting in weaker backscatter. This contrast makes SAR a powerful complement to optical indices for monitoring both crop growth and structural damage.
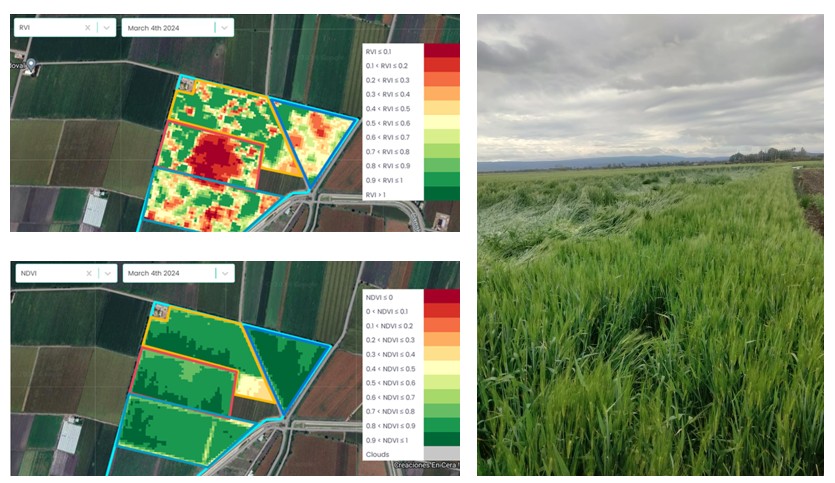
NDVI remains high in lodged barley, while RVI (top left) highlights the affected areas in red due to reduced backscatter. The field photo confirms the lodging pattern, with flattened barley on the left and standing crop on the right.
Integrating multiple layers for real agronomic insight
Not every spectral variation represents stress. Single indices tell partial stories. The power comes from combining spectral, thermal, and radar layers within a consistent crop model.
For example, a zone with lower NDVI, NDMI, and radar indices may simply contain smaller plants or thinner canopy, not physiological stress. True stress usually shows divergence between indices, for instance, NDVI remaining stable while NDRE or NDMI decline, or NDVI high but radar backscatter increasing due to excess moisture below the canopy. Distinguishing structural differences (plant size, stand density) from functional stress (chlorophyll or water loss) requires reading several indices together, not just one.
In advanced systems like yieldsApp, these multi-index layers are not just displayed as maps, they feed into dynamic crop models that interpret whether the signal change matches water, nutrient, or disease stress. This integration bridges remote sensing and actionable agronomy.
Ground truth still matters
Even the best satellite or drone imagery can’t replace boots on the ground. Remote sensing indicates where something unusual is happening, but not always why.
The practical workflow should always include:
- Detect: Identify anomalies from multi-layer imagery.
- Verify: Ground-check a few representative spots using sensors, scouting, or tissue samples.
- Decide: Adjust irrigation, fertilization, or protection programs based on confirmed diagnosis.
Farmers who combine imagery with soil moisture probes, weather data, and tissue analyses build stronger correlations between spectral indices and real crop conditions, allowing more accurate decisions each season.
NDVI was the entry point into digital agronomy, but it’s no longer enough. Thermal imagery provides physical insight into canopy temperature at broader scales, chlorophyll and red-edge indices reveal nutrient or disease problems before they’re visible, and SAR data penetrates clouds to expose hidden structural or moisture patterns.
Multi-sensor interpretation helps identify not only when stress occurs, but also whether variability represents a true physiological issue or simply differences in plant size or canopy density. This understanding enables earlier, targeted, and more reliable management decisions, the essence of agronomic intelligence.